

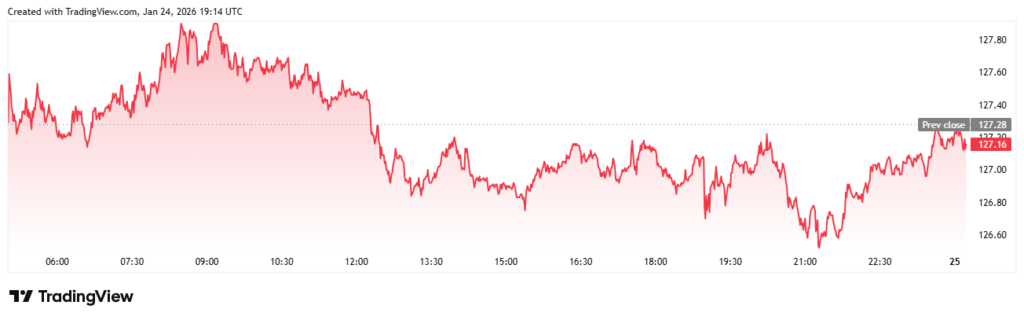
Solana ($SOL) is going through a price consolidation these days. However, this consolidation is occurring within a descending triangle price pattern. With this pattern, it presents the indication of indecision among $SOL traders. As per the data from TradingView, $SOL is now changing hands at 127.17, below the resistance trendline, signifying the current bearish pressure. Keeping this in view, $SOL’s market outlook points out the possibility of a bull rally ahead.
$SOL Consolidates within Descending Triangle as Traders Await Confirmation
The ongoing consolidation of Solana ($SOL) within the descending triangle highlights a relatively inconclusive market outlook. Specifically, Ichimoku Cloud reportedly stands above a likely price action. At the same time, the cryptocurrency is facing a solid resistance barrier hindering its upward momentum. Thus, while $SOL is trading at $127.17, the confirmation of a breakdown or breakout will play a crucial role in determining its next directional move. Like majority of other altcoins, SOL too is waiting for Bitcoin ($BTC) to show some life. Bitcoin’s sideways movement for the past 2 months is affecting the overall market.
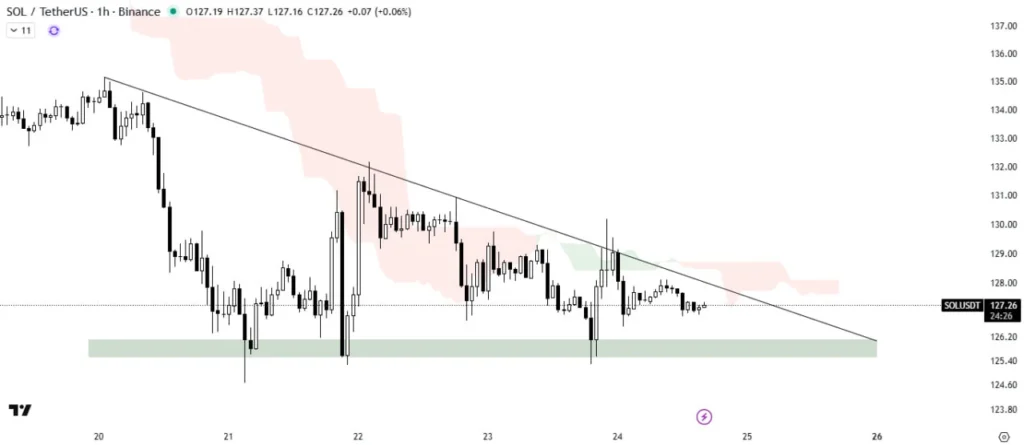
In this respect, the $126.20 mark provides an important short-term floor where purchasers have repeatedly entered to prevent further declines. So, a breakdown below this mark could ignite a continuous selling pressure. Contrarily, Ichimoku Cloud keeps serving as a ceiling, reaffirming resistance territory that limits bullish attempts. Along with that, the compressed candles within the descending triangle reflect the strategic consolidation ahead of a likely meaningful upsurge. A meaningful upsurge will also unlock barriers for long term Solana price predictions.
However, Solana’s market sentiment remains cautious while traders are waiting for a breakdown or breakout confirmation. Particularly, a bullish breakout above the Ichimoku Cloud and descending trendline could lead to a considerable spike toward the $133-$137 range. Such a move would potentially bring in momentum buyers and fortify confidence in the short-term recovery of $SOL.
Technical Outlook Highlights Potential of Volatility
According to TradingView’s data, while $126.20 offers a notable support zone, a slump below it could accelerate the selling pressure. In such a case, $SOL could move near the lower boundary of the price chart. Along with that, the descending triangle pattern also signifies imminent volatility. Overall, this scenario displays the requirement for the traders to keenly watch for and get ready for big moves in any direction.
This article is for educational purposes only and does not constitute financial or trading advice. Cryptocurrency market is highly volatile, and price movements can change rapidly. Readers should conduct their own research and consult professionals before making any investment. The author and publisher are not responsible for any financial losses resulting from reliance on this information.

Umair Younas is a veteran crypto journalist with 6 years of experience. He writes on various categories including Bitcoin ($BTC), blockchain, Web3 and the broader decentralized finance (DeFi) space. He pens well-researched price analysis and prediction articles in addition to credible news articles. He writes easy-to-grasp educational articles to fulfil his aim of creating blockchain awareness.
- Umair Younas

- Umair Younas
- Umair Younas
- Umair Younas